– display the percentage of volume by price. Useful to compare between days or instruments as a percentage is a ratio or a relative number and expressed as a fraction. This is also useful if you are looking at low/high volume areas that are below a certain percentage value.
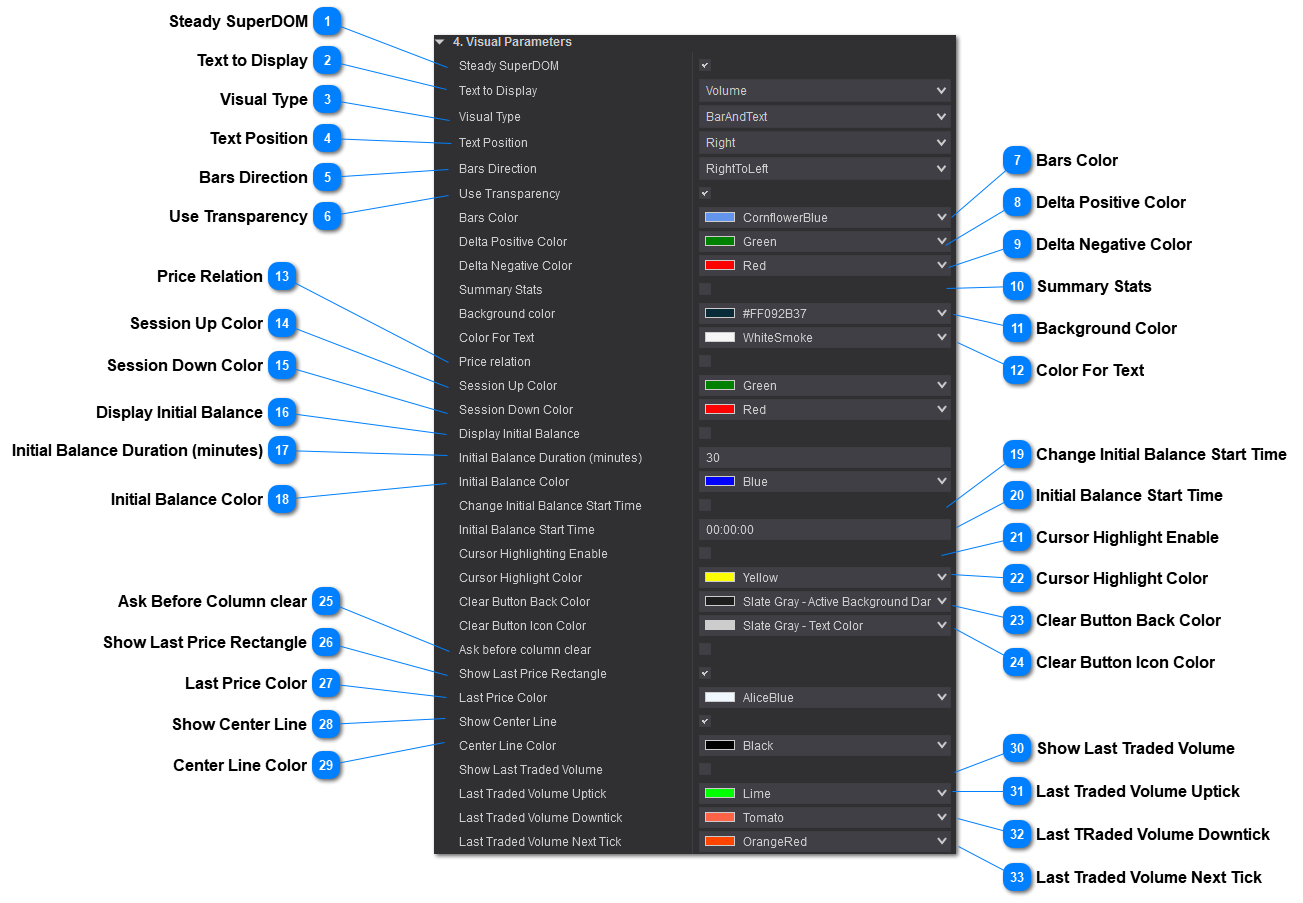
Visual Type
Set the Visual Type
Bar and Text
– display both the Bar in its relative size as well as any text chose in the previous setting.
Bar
– display only the bars. On Mouse Hover text will be displayed for the particular price.
Text
– display only text.
Text Position
Sets the position of the Text Relative to the cell.
Bars Direction
Left to Right
– Bars will start from the left end and populate to the right.
Right To Left
– Bars will start from the right and populate to the left.
Use Transparency
Transparency is set relative to the total profile volume. This will create a visual effect that will allow you to spot areas that heavily traded in comparison to low volume traded areas. This gives you instant visual feedback.
Bars Color
Sets the color of the bars outside the Value Area and VPOC. If the Show VA and VPOC is disabled this color will be applied to all bars if Visual Type setting is set to Bars or Bars and Text.
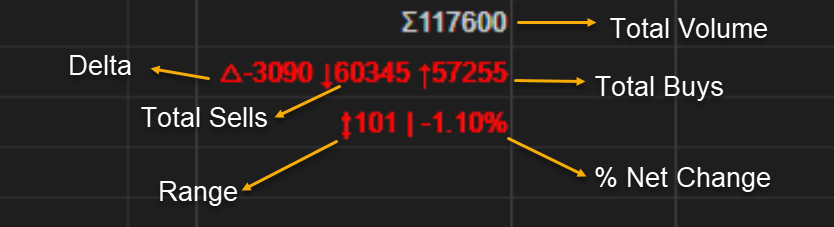
– Total volume of the session – Text color inherits the color of Color for Text.
Delta
– Total amount of buy-side volume minus sell side volume – Text color inherits from the Delta Negative or Positive Color.
Sells
– Total amount of sell-side volume – Text color inherits from the Delta Negative or Positive Color.
Buys
– Total amount of buy-side volume – Text color inherits from the Delta Negative or Positive Color.
Session Range
– Shows the range of the session in price levels – Text color inherits from the Delta Negative or Positive Color and its colored based on the percentage change of the session.
Session Percentage Change
– Text color inherits from the Delta Negative or Positive Color and its color based on the percentage change of the session.
Background Color
Sets the color for column background.
Color For Text
Sets the color for text.
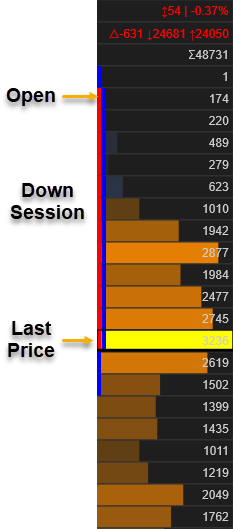
Price Relation
Sets visibility of Price Relation. Price Relation will display a small rectangle at the base of the profile indicating if the session is up (last price is higher than the open - positive session) or down (last price is lower than the open - negative session)
Session Up Color
Sets the color for up Session.
Session Down Color
Sets the color for down Session.
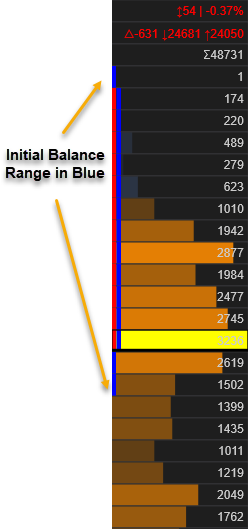
Display Initial Balance
Sets the visibility of the Initial Balance. When enabled Initial Balance will be displayed as a small rectangle at the the base of the profile.
Initial Balance Duration (minutes)
Sets the Initial Balance duration in minutes.
Initial Balance Color
Sets the Color for the Initial Balance.
Change Initial Balance Start Time
Override the Initial Balance Start Time. This allows to have a ETH Session Profile but set the start of the Initial Balance to the time of the RTH Session open.
Initial Balance Start Time
Sets the overridden Initial Balance Start Time.
Cursor Highlight Enable
Sets the visibility of highlighting a cell on mouser hover.